Energy Leads the Rotation Into a 5% 10-Year and the FOMC
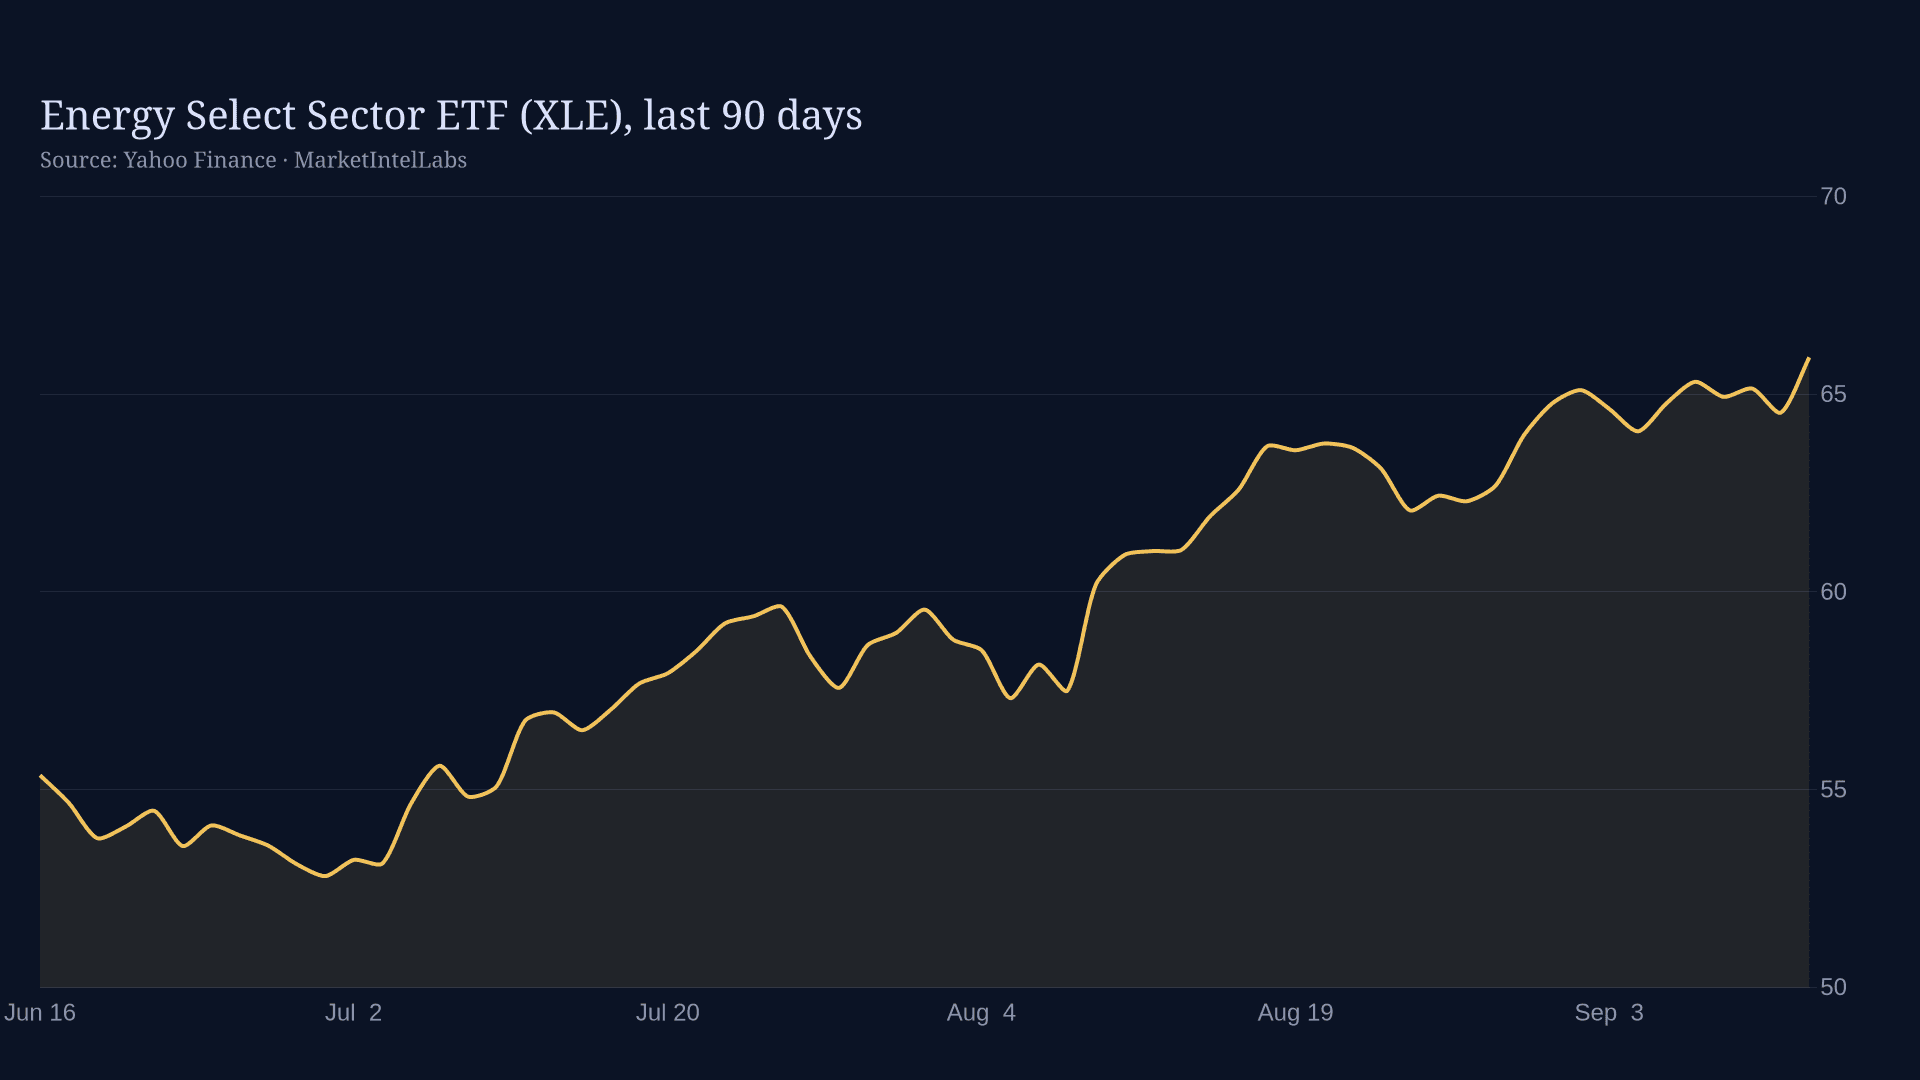
Energy is the only thing green on the tape this morning, and that single split tells you more about how this market is positioned for today's FOMC than any index print does. The S&P 500 sits down about 0.5% with the 10-year Treasury at 5.00%, its highest since 2023, and the rotation underneath is doing the real work: XLE, the energy ETF, is the session's standout winner at +2.17%, while consumer discretionary (XLY, down 1.75%) and utilities (XLU, down 1.20%) are bleeding. That is not random sector rotation. It is the market positioning itself for the exact trade that a higher-for-longer Fed, a 5% long end, and an oil supply shock create.
Key Takeaways The 25bp September hike to a 3.75-4.00% r…
Continue reading with Premium
The full equities analysis, with levels, positioning, and what changed, continues below the line.
- checkFull deep-dive reports while they're current: levels, positioning, and conviction scores
- checkWatchlist changes as our analysts make them
- checkExclusive investigative reports
Not ready? Create a free account for extended previews · Already a member? Log in
Secure checkout via Stripe