macroboltSpecial Coverage

August Producer Price Index: What It Means

Published September 10, 20264 min read
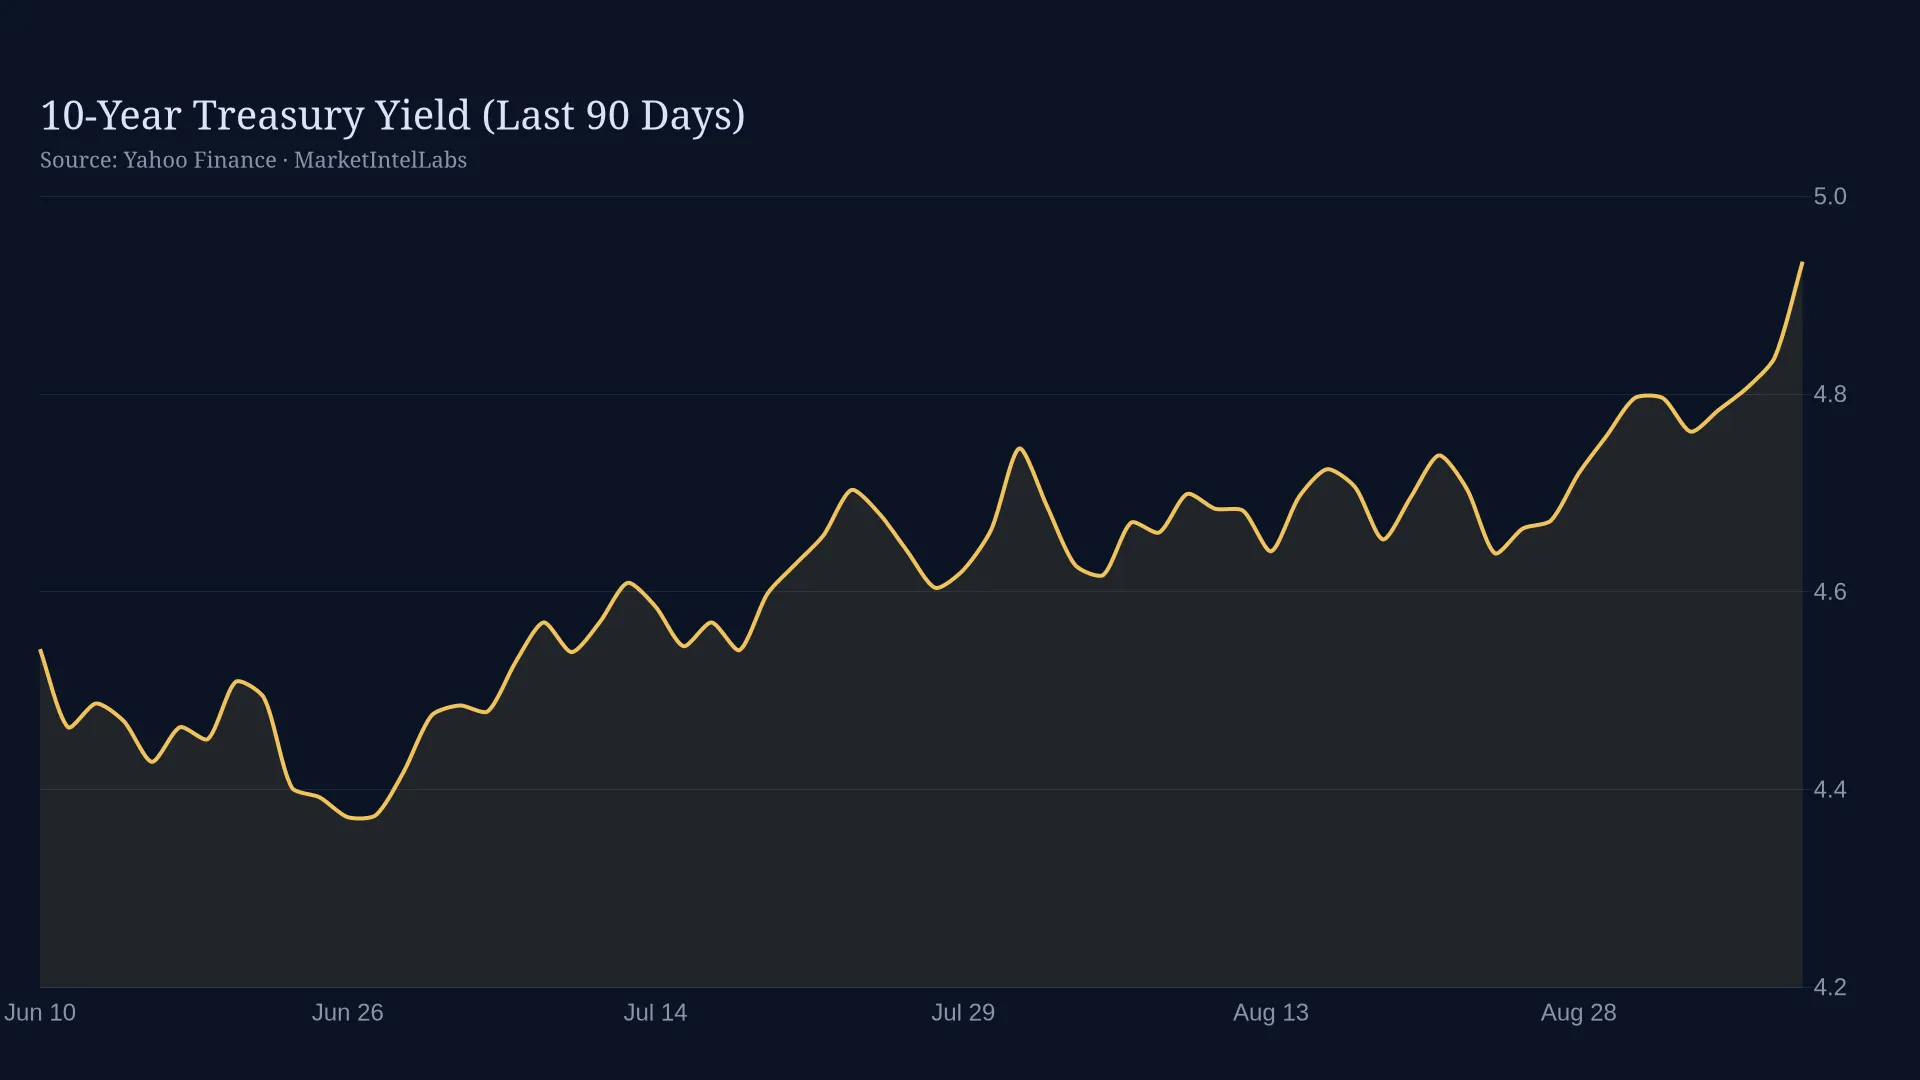
Line chart of 10-Year Treasury Yield on a dark background

The August Producer Price Index landed at +0.9% month-over-month, far above the -0.5% consensus and a sharp reversal from July's -0.8% decline. On a year-over-year basis, producer prices rose +6.4%, accelerating from July's +1.5% and shattering expectations for a +1.8% print. This is not a benign August CPI: What to Watch as Inflation Data Lands reading. The disinflation process that supported risk assets through the summer faces its first serious challenge.

The magnitude of the surprise demands attention. Producer prices typically feed consumer prices with a 2-3 month lag, so August's surge would show up in the October and November CPI reports. That timeline is problematic for the Federal Reserve, which has telegraphed a desire to begin easing policy by November if inflation continued on its downward path. This print breaks that narrative. The core PPI, which excludes food and energy, showed similar strength, indicating the price pressure is broad-based rather than concentrated in volatile components.

July's prior print was revised modestly higher as well, consistent with the pattern of revisions seen throughout 2026. When initial prints come in softer than the trend and are subsequently revised higher, it suggests the underlying inflation dynamic is more persistent than the headline numbers indicate. The August release confirms that pattern. The timing is particularly poor for risk assets, which had spent the summer pricing in an accelerating Fed easing cycle. Treasury yields immediately moved higher on the release, with the two-year note leading the charge. The dollar index also strengthened as rate differentials widened in favor of the United States.. For more on the Fed, see our Fed policy framework.

The market response tells you everything about how positioning has shifted. Stocks sold off on the news, with SPY down -0.46% as the discount rate for future earnings moved higher. Treasuries fared worse, with TLT falling -0.57% as the bond market repriced the path of short-term rates. This is the opposite of the benign reaction function that had developed earlier in the year, when softer inflation prints were met with relief rallies and stronger prints were shrugged off as noise. The fact that this PPI print moved both bonds and stocks so sharply suggests the market had become too aligned with a benign inflation narrative and was caught offside by the reversal.

The transmission to Fed policy is straightforward. Federal Reserve officials have repeatedly stated they need to see sustained progress on inflation before easing, and this print represents a step backward rather than forward. The September FOMC meeting, which markets had priced as a live meeting for a rate cut as recently as last week, is now effectively off the table. November remains in play but will require a reversal of this trend in the September and October data. The December meeting becomes the more realistic target for the first rate cut, and even that assumes the PPI surge proves to be a temporary deviation rather than a new trend.

The question now becomes whether this is a one-month anomaly or the start of a renewed inflation trend. The internals of the report offer some clues. Goods prices, which had been declining for several months, showed their first increase since March. Services prices, which have been the stickiest component, accelerated. Energy prices, which had been a disinflationary drag, turned higher as oil prices rebounded from their summer lows. The breadth of the price increases across categories suggests this may be more than a statistical quirk. The Fed will be watching the September and October PPI releases closely for confirmation of a trend before adjusting its policy stance.

Looking forward, all eyes shift to next week's CPI release, which will show how these producer prices are flowing through to consumer prices. The correlation between PPI and CPI has weakened in recent years as the composition of the economy shifts toward services, but PPI remains a leading indicator for goods inflation. If CPI shows similar strength next week, the Fed's September and November meetings are both off the table. If CPI is softer than PPI, the Fed may interpret this as a temporary pass-through issue rather than a resurgence of inflation. Either way, the path to 2% inflation is now longer and bumpier than markets had assumed. The reaction function has changed.

Related reading: August PPI Jumps 0.9% vs Consensus for Decline, Inflation Pressure Rebounds. Fed Signals No Rate Cuts as Inflation Moderates. August CPI: What to Watch as Inflation Data Lands.

This content is for informational purposes only and does not constitute financial advice. Past performance is not indicative of future results. Consult a qualified financial advisor before making investment decisions.

Get daily intelligence delivered

Create a free account for the Daily Brief every weekday and The Week Ahead every Sunday. No card required.