Gas Hits $4.48 as August Shelter Costs Rise

Regular gasoline reached $4.48 a gallon in the week of September 21, 2026, according to the U.S. Energy Information Administration’s weekly national average. That is the clearest household cost signal this week: fuel is up 65 cents from late June and about $1.30 from the comparable week a year earlier, when the EIA’s weekly national average read $3.17 a gallon, before taxes, driving patterns, or regional differences enter the bill.
The pressure is concentrated in energy, not evenly spread across every part of the family budget. The latest full monthly Consumer Price Index available at the start of the week is August. The Bureau of Labor Statistics reported the all-items CPI-U index at 334.980 in August, 0.3% higher than July’s 333.918 and 3.4% above August 2025’s 323.976. That is a price index, not a household bill, but it sets the backdrop for costs that households see at checkout and at home.
For a $2,200 monthly rent benchmark, August shelter CPI rose 0.3% from July, from 429.491 to 430.611. Applying that change to the benchmark implies roughly $6 more per month. Compared with August 2025’s shelter index of 417.902, the index is 3.0% higher, equivalent to about $67 a month on that same illustrative rent. This is an index-based translation, not a prediction of an individual lease renewal; local rents and lease timing differ.
Food at home offered some relief on a month-to-month basis. Its CPI index eased from 321.643 in July to 321.500 in August, down less than 0.1%, while remaining 2.2% above the 314.608 level a year earlier. Put against a $700 monthly grocery budget, that annual index increase is about $15 a month compared with the year-ago baseline. The decline from July is small enough that it does not erase the accumulated rise, but it does show that grocery inflation was not accelerating in the latest print.
Gas is doing the near-term damage
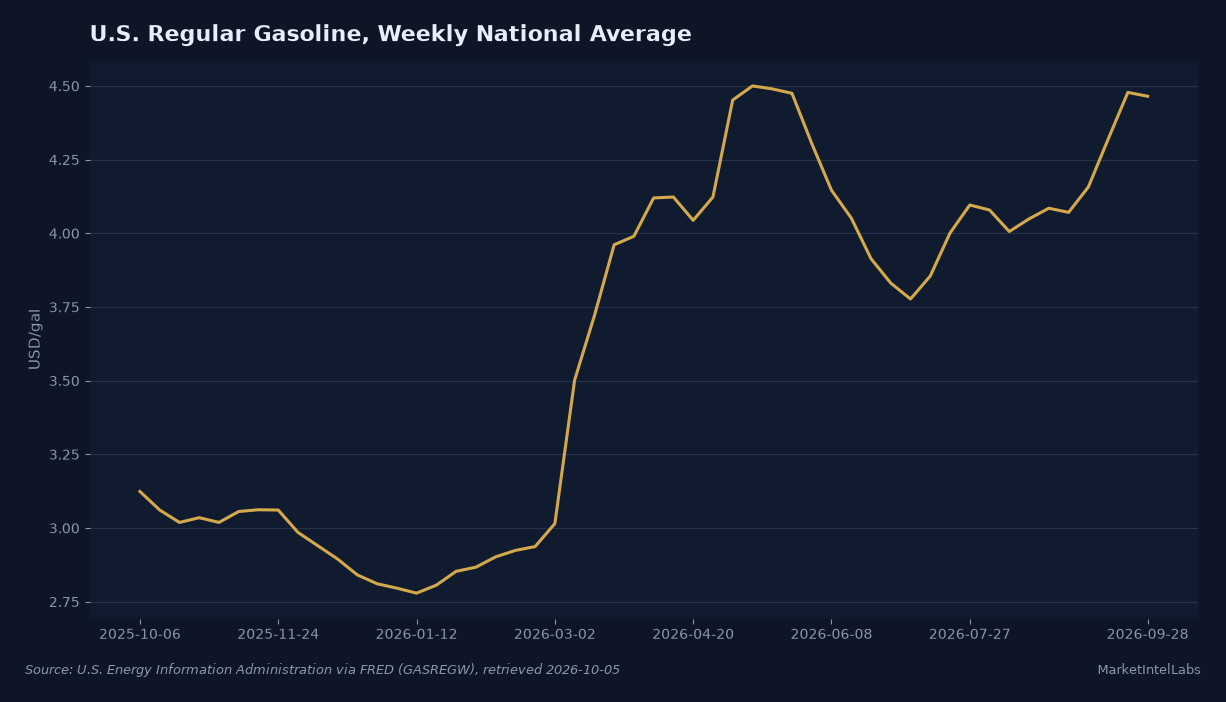
The EIA’s weekly regular gasoline series moved from $3.83 a gallon for the week of June 29 to $4.48 for September 21. That late-September reading is 17% above the June 29 level. For a household buying 40 gallons in a month, a 65-cent-per-gallon increase means about $26 more than at the end of June. Against the comparable week a year earlier, when the EIA’s weekly national average read $3.17, the latest price adds roughly $52 to that same 40-gallon monthly fill-up assumption.
That is the consumer side of a volatile energy input, not evidence by itself of an economy-wide reacceleration. The BLS August energy CPI index jumped from 325.150 in July to 329.351 in August, a 1.3% monthly increase, and stood 16.3% above August 2025’s 283.247. Gasoline is part of that exposure, while utility bills move on separate schedules and local rate structures. The available BLS average prices put electricity at 19.6 cents per kilowatt-hour in August, slightly below July’s 19.7 cents but above 19.0 cents a year earlier. Piped utility gas rose to $5.15 per thousand cubic feet in August from $4.80 in July and $3.58 a year ago.
There is a counterpoint in core inflation. The CPI index excluding food and energy rose from 337.133 in July to 338.041 in August, a 0.27% monthly gain, and was 2.4% above August 2025’s 329.970. It is not a low enough reading to call the cost problem solved, but it shows the sharper monthly pressure in August was concentrated in energy. A household’s experience will depend on whether it drives a lot, uses gas heat, or faces a lease reset; the averages do not describe each family equally.
What is dated next
The next key release is the September CPI report, scheduled by the BLS for Wednesday, October 14 at 8:30 a.m. Eastern. That report will show whether late-summer energy strength carried through into the monthly inflation measure and whether shelter continued its gradual rise. The BLS schedule also lists September real earnings for the same morning. Until then, August remains the latest verified CPI month; no September CPI outcome is available yet.
For context on the household arithmetic, a $2,200 rent, $700 grocery budget, and 40 monthly gallons are examples rather than national household averages. They translate the published indexes and prices into familiar spending lines; they do not account for taxes, regional price differences, fuel economy, household size, or contract changes. On those assumptions, the gasoline move since June is the biggest immediate weekly budget change, while shelter remains a slower, persistent cost and groceries are barely lower month to month.
The practical signal is to separate one volatile pump-price jump from the broader inflation trend. If gasoline stays near late-September levels, commuting households will feel it quickly, but the October 14 CPI report will be the next test of whether that squeeze is showing up beyond the forecourt. This content is for informational purposes only and does not constitute financial advice. Past performance is not indicative of future results. Consult a qualified financial advisor before making investment decisions.
Related Reading
- Why Soft PCE Left the 10-Year Treasury Yield at 5.29%, August's PCE reading sat below the prior-month peak, yet long yields barely moved. The episode shows why a cooling inflation index does not always translate into cheaper borrowing.
- 7.28% Mortgage Rate Adds $251 to a $400,000 Loan, Shelter is the biggest line in most household budgets, and mortgage rates are the lever that moves it. Here is the monthly-dollar math behind a 7.28% 30-year rate on a $400,000 loan.
- G7 and IEA release 100 million barrels of oil and diesel, Energy is doing the near-term damage in this CPI cycle. We tracked how a coordinated release of 100 million barrels aimed at the diesel squeeze feeds through to the pump.
- For the broader inflation backdrop behind the pump and the rent bill, see our Fed policy coverage.
Get daily intelligence delivered
Create a free account for the Daily Brief every weekday and The Week Ahead every Sunday. No card required.