equities

Breadth Confirms the Damage Into Friday's Session

Published August 21, 20262 min read
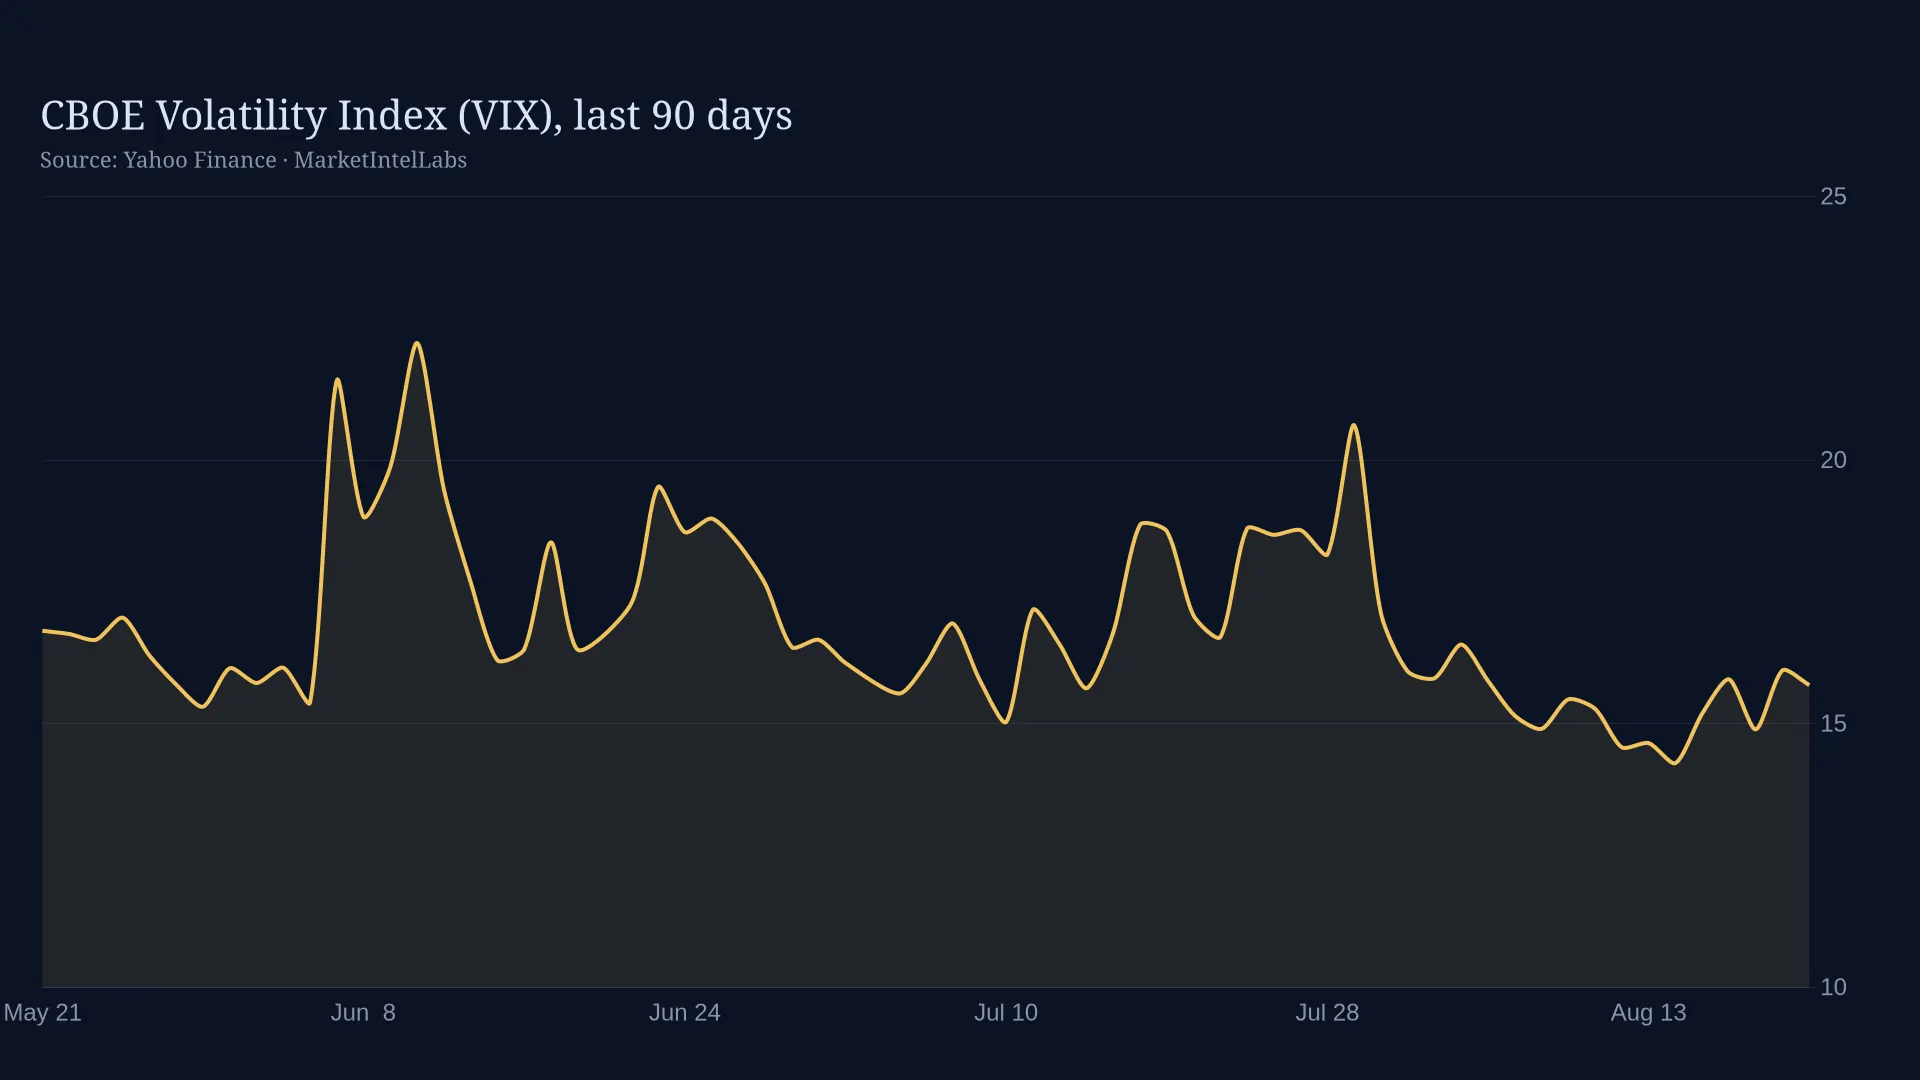
Line chart of CBOE Volatility Index (VIX), last 90 days on a dark background

Breadth did what the index headlines could not: it told the truth about this week's bounce. NYSE advancers collapsed to 931 from 1,769 in a single session Thursday, while decliners nearly doubled to 1,821 from 1,002, and that reversal is the reason Friday's session opens on defense rather than looking for a follow-through rally.

Related research: Fed Hawkish Tilt Treasury Buyback Narrative Flip, Equities Yield Relief Healthcare Record Tech, Bitcoin Etf Treasury Buybacks Sec Rule.

The internals matter more than the index print here. Wednesday's rally was already narrow, a healthcare-led move on a single oncology data readout while technology and semiconductors lagged the broader tape. Thursday's reversal simply confirmed that narrowness was fragile rather than a rotation into strength. New lows on the NYSE rose to 77 from 56 and Nasdaq new lows climbed to 135, both a meaningful step up from the prior session, and the Arms Index at 0.60 on Nasdaq and 0.77 on NYSE shows the selling was volume-confirmed, not a handful of large-cap names skewing the average.

NYSE advance/decline bar chart: advancers fell to 931 from 1,769 while decliners rose to 1,821 from 1,002, Wednesday Aug 19 to Thursday Aug 20, 2026. Source: Barron's Markets Diary.

Volatility is sending the same message from a different angle. The VIX has swung from a 2026 low near 14.2 earlier this week to Friday's 16.01, a 7.52% single-day jump that reflects hedging demand catching up to price action rather than leading it. That sequencing, price falls first and volatility follows, is typical of a market that had gotten complacent into Wednesday's bounce and is now repricing risk more honestly.

Rates are the mechanism connecting the two. The 30-year Treasury yield rebounded to 5.24% and the 10-year to 4.69-4.70% by Friday morning, erasing nearly all of Wednesday's drop that followed the Treasury's expanded long-bond buyback program. Small caps underperformed large caps this week, IWM fell 1.34% versus SPY's 0.84% decline, which is the classic signature of financing costs working against risk assets rather than a broad growth scare.

Into next week, watch two things ahead of the headline index level: whether the 30-year yield can hold below 5.2% now that the Treasury has shown its hand on buybacks, and whether NYSE breadth stabilizes above the 1,000-advancer mark or keeps deteriorating. The Jackson Hole symposium, August 27-29, is the next scheduled catalyst that could move both at once.

This content is for informational purposes only and does not constitute financial advice. Past performance is not indicative of future results. Consult a qualified financial advisor before making investment decisions.

Get daily intelligence delivered

Create a free account for the Daily Brief every weekday and The Week Ahead every Sunday. No card required.