ADP Is Now Publishing Jobs Data Every Tuesday, and Its First Weekly Pulse Shows Private Hiring Grinding Higher

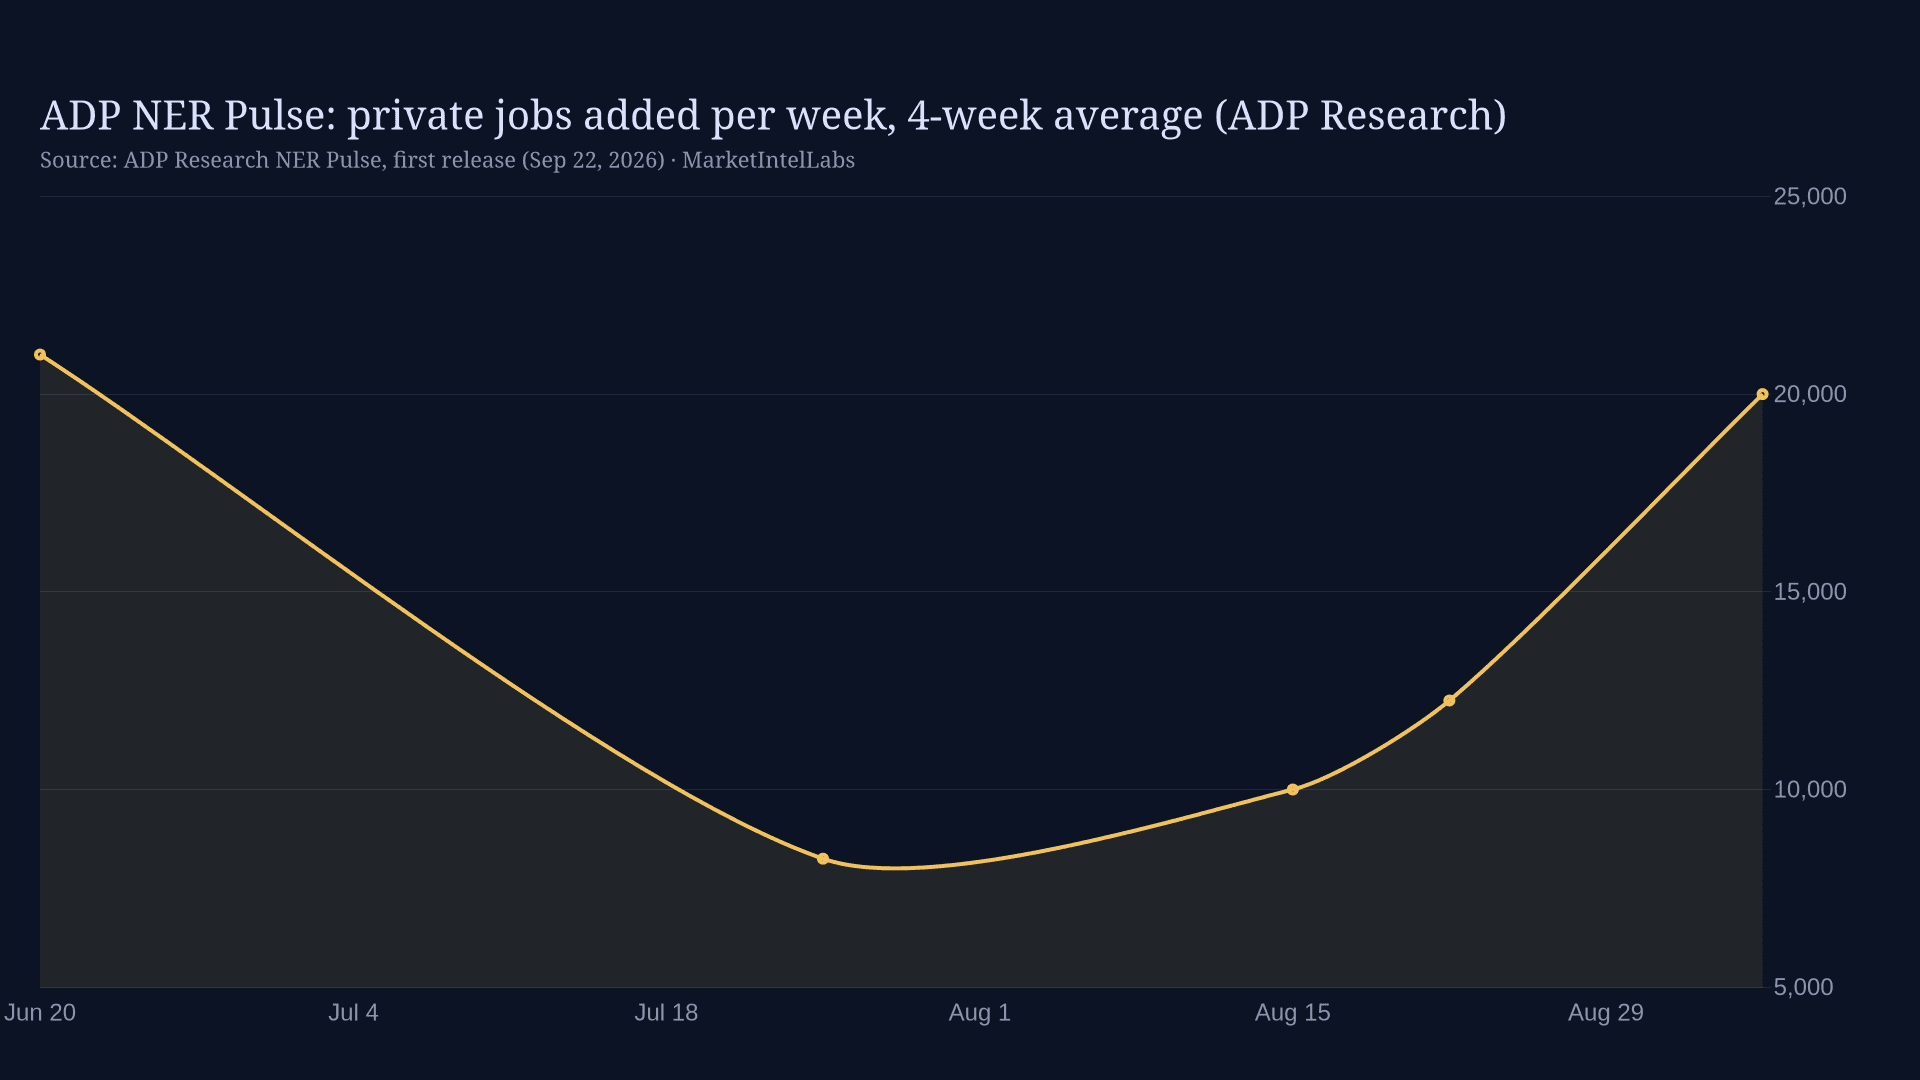
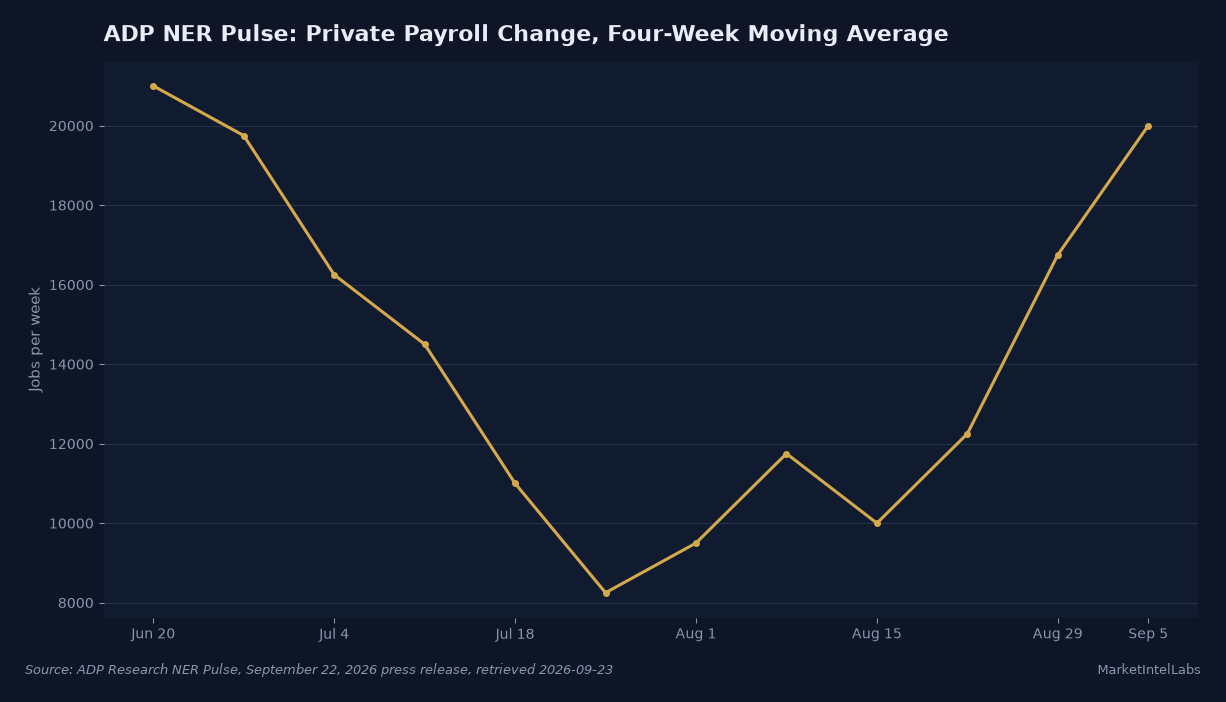
The most useful new number on the jobs beat is not from the government. On September 22, ADP Research began publishing the NER Pulse, a weekly estimate of private employment change built on the same payroll data behind its monthly National Employment Report. The first release covers the four weeks ending September 5, 2026, and puts the four-week moving average at 20,000 jobs added per week, the third consecutive weekly acceleration after averages of 10,000 for the week ending August 15 and 12,250 a week later, according to the ADP press release.
The level matters less than the direction, but both are worth sitting with. Twenty thousand a week annualizes to roughly 1.04 million private jobs a year, which sounds healthy until you remember the economy has been adding far less than that in the official count. The government's August payrolls report, released September 21, showed 162,000 headline jobs but a three-month average of just 71,300. ADP's weekly series, taken at face value, says private hiring has been inching off a July floor, when the four-week average sat at 8,250 for the week ending July 25.
Three things make this series worth your attention, and one thing should temper enthusiasm.
First, timeliness. The official payroll count arrives once a month with a reference week around the 12th, and this cycle it arrived late, released more than six weeks after its original date. Weekly initial claims are the only high-frequency federal labor series, and they measure flows into unemployment, not hiring. A weekly payroll estimate closes a genuine gap. Market participants have been reading claims as a proxy for the whole labor market for two years; now there is a second weekly series that speaks directly to job creation.
Second, continuity. The Pulse is not a new survey. It is drawn from the same ADP payroll universe as the monthly report, produced with Stanford Digital Economy Lab, so the weekly prints roll into the monthly number rather than sitting beside it as a rival estimate. That gives the series a defined relationship to a number markets already trade, which is more than can be said for most alternative data.
Third, the trend itself. The twelve-week history in the first release shows a clear shape: averages fell from 21,000 in the week ending June 20 to the 8,250 July trough, then rose five of the last six weeks to 20,000. That is a V-shaped bottom in the hiring rate, small in absolute terms but consistent in direction. It also rhymes with the September 21 initial claims print of 196,000 for the week ending September 12, about 16 percent below the same week last year, which we covered here earlier this week. Hiring is weak and firing is rare. That combination has defined this labor market since spring, and ADP's weekly lens now shows the hiring side of it bending upward.
The tempering note: the numbers are preliminary and carry a two-week lag, as ADP states in the release. The 20,000 figure for the week ending September 5 will be revised as more payroll records come in, and the series has no track record yet. Nobody knows how much it moves before it settles, because it has never settled. A four-week moving average smooths weekly noise, but smoothing is not accuracy. Read it the way you would read a claims four-week average, as a direction indicator, not a point forecast of the monthly report. ADP's own monthly estimate has diverged from the BLS count by tens of thousands of jobs in recent years, and a weekly derivative of that methodology inherits the uncertainty.
What it means going forward: the Fed has been operating in a fog on labor. The delayed September report, the government shutdown disruptions of the data calendar this year, and a payroll count that has been revised heavily in both directions have left policymakers leaning on claims and anecdote. A weekly private payroll series does not fix the statistical problem, but it shortens the feedback loop from months to weeks. If the Pulse keeps climbing toward 30,000 or 40,000 a week while claims stay under 220,000, that is a labor market stabilizing without reaccelerating, which is roughly the soft-landing picture. If the Pulse rolls over again while claims stay low, that is stagnation dressed as stability, and it would argue the July trough was not a trough at all.
The next NER Pulse arrives October 6, 2026, per the ADP release calendar, covering weeks through roughly September 19. That print will show whether the hiring pickup survived the September reference week. The monthly ADP National Employment Report for September follows on September 30. Between the two, we get the first real test of whether a weekly series built on payroll processing data can add signal where the official statistics have been running late and noisy. Watch the direction of the average, not any single week.
Related reading: Jobless Claims Hit 196,000, a 1960s-Level Print Firms Are Not Firing; Openings Rose, Hiring Fell 294,000: The July JOLTS Report Split the Labor Market; State Unemployment in August Hid a 1.8 Point Spread Behind the 4.1 Percent Average.
This content is for informational purposes only and does not constitute financial advice. Past performance is not indicative of future results. Consult a qualified financial advisor before making investment decisions.
Get daily intelligence delivered
Create a free account for the Daily Brief every weekday and The Week Ahead every Sunday. No card required.