Tech Slides Tuesday as 30-Year Yield Tops 5.3%

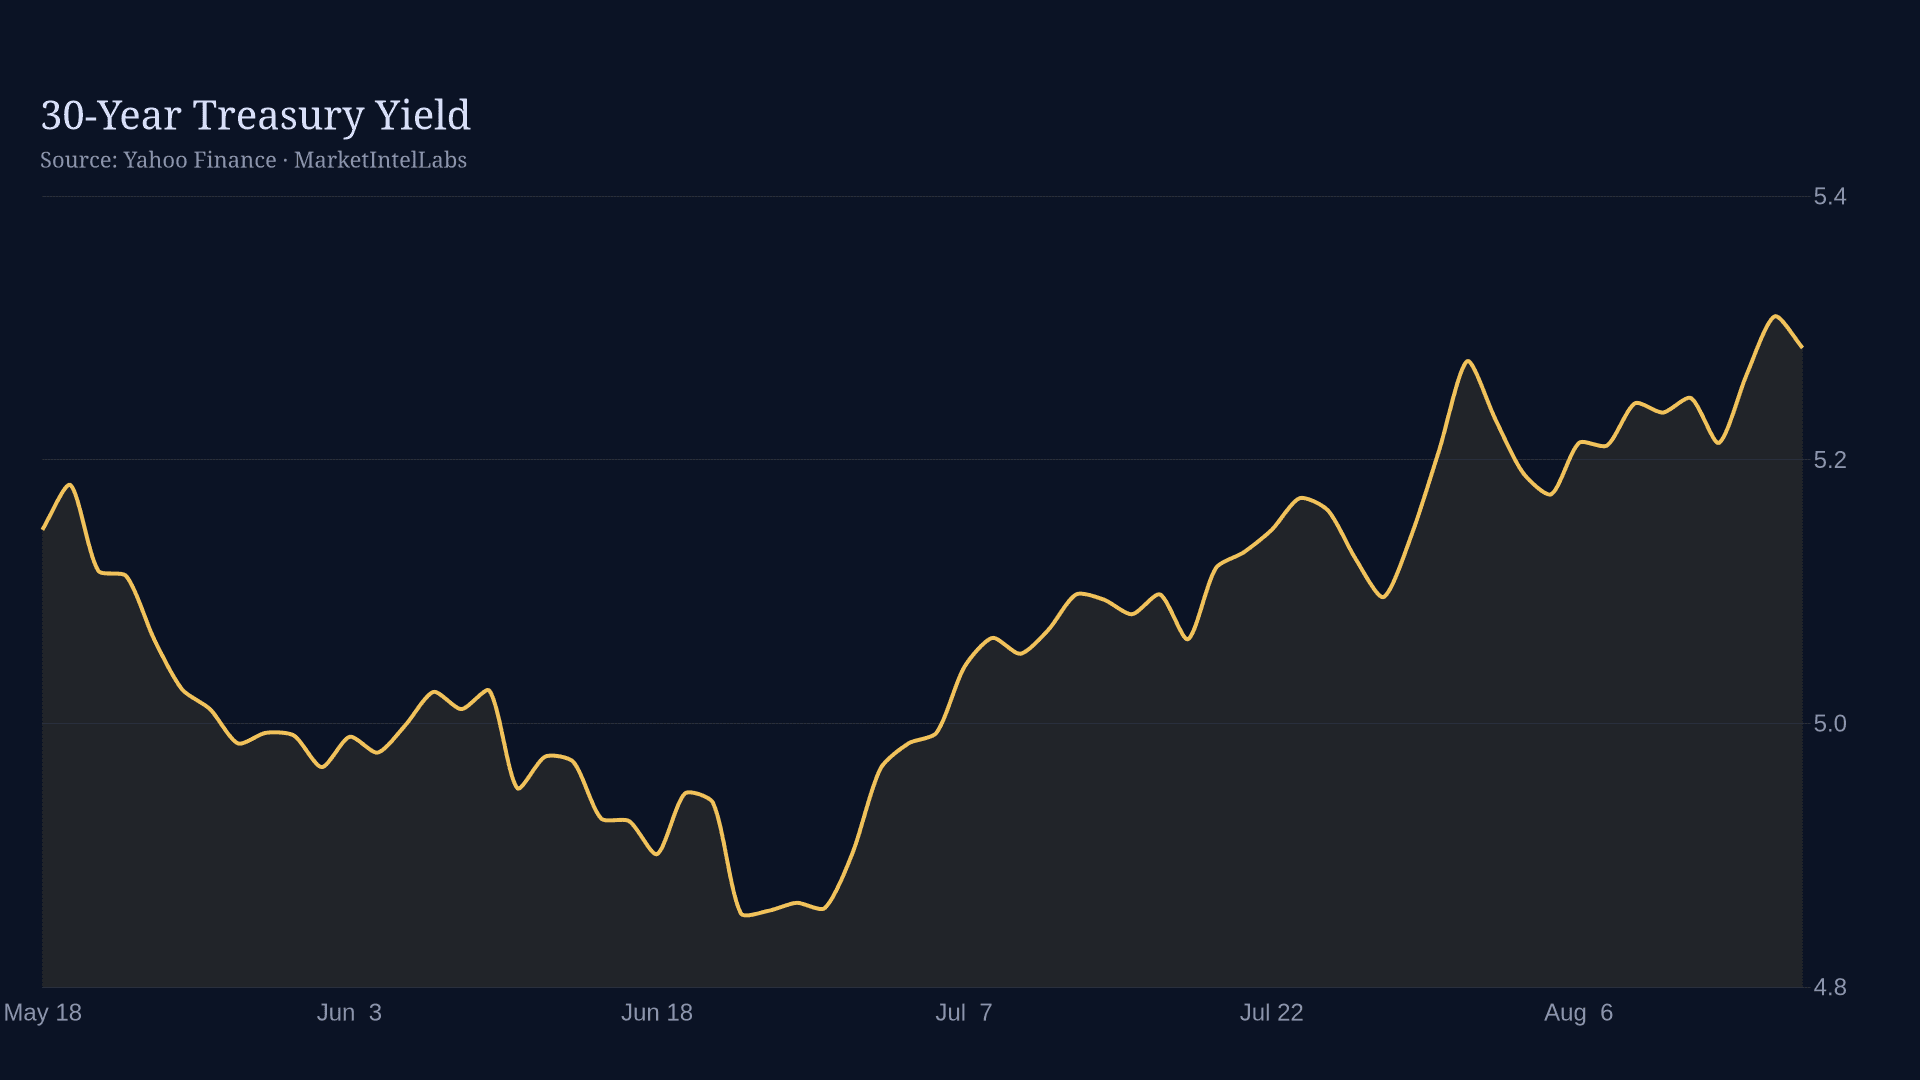
Tuesday's session was a rates story wearing an equity costume. The S&P 500 closed at 7,691.76, down 0.69%, and the Nasdaq Composite fell 1.33% to 26,289.71, the sharpest one-day decline for both indexes since July 29, as the 30-year Treasury yield touched 5.327%, its highest print since 2007 (Reuters, Aug 18, 2026).
\n Related Reading Chariot Resources Surges 39% on China Lithium Term Sheet Home Depot Q2 FY2026: $4.92 Adjusted EPS Tops $4.73 Consensus as Revenue Clears $47.9 Billion OFAC Purges 84 Entries From the SDN List: What Bessent's Doctrine Shift Means for Banks and Cross-Border Corridors \n\n Related Reading Chariot Resources Surges 39% on China Lithium Term Sheet Home Depot Q2 FY2026…
Keep reading with a free account
Get tomorrow's institutional market briefing before markets open, produced by specialized AI analysts researching markets 24/7. Takes under a minute, no card required.
- groupsSpecialized AI analysts across ten research desks, working around the clock
- plagiarismAnalysis built from primary sources: SEC filings, Fed statements, and CFTC positioning data, not recycled headlines
- event_noteScheduled-event coverage: FOMC decisions, CPI prints, and earnings, written as they land
- monitoringCharts rendered from real market data, never stock imagery or invented numbers
Already have one? Log in · Want everything the day it publishes? Go Premium
Secure checkout via Stripe